Managing a project in SitePodium is now more insightful than ever. With the refreshed Project Insights, you get more than just numbers. You gain a clear view of how your project is performing and where you can take meaningful action.
From understanding your audience to spotting patterns and sharing results, this update puts you in control.
Highlights of the new insights
The updated dashboard gives you a quick overview of essential data.
You can now see:
- Users – total people who visited your project
- Followers – those who opted in to receive updates
- Engaged users – users who opened updates, reacted, or interacted in other ways
You can also switch between views for the last 7 days, last 30 days or total, to spot trends over time.
Measure your reach
Track how well your updates are performing with new notification and interaction metrics:
- Number of push notifications sent
- Number of updates opened
- Total views on each update
- Breakdown of reactions, including Like, Love it, Good idea, Worried and more
Tip: Low open rates? Try starting your update with something specific and urgent. For example, “Road closure: important info” often works better than “Hello everyone”.
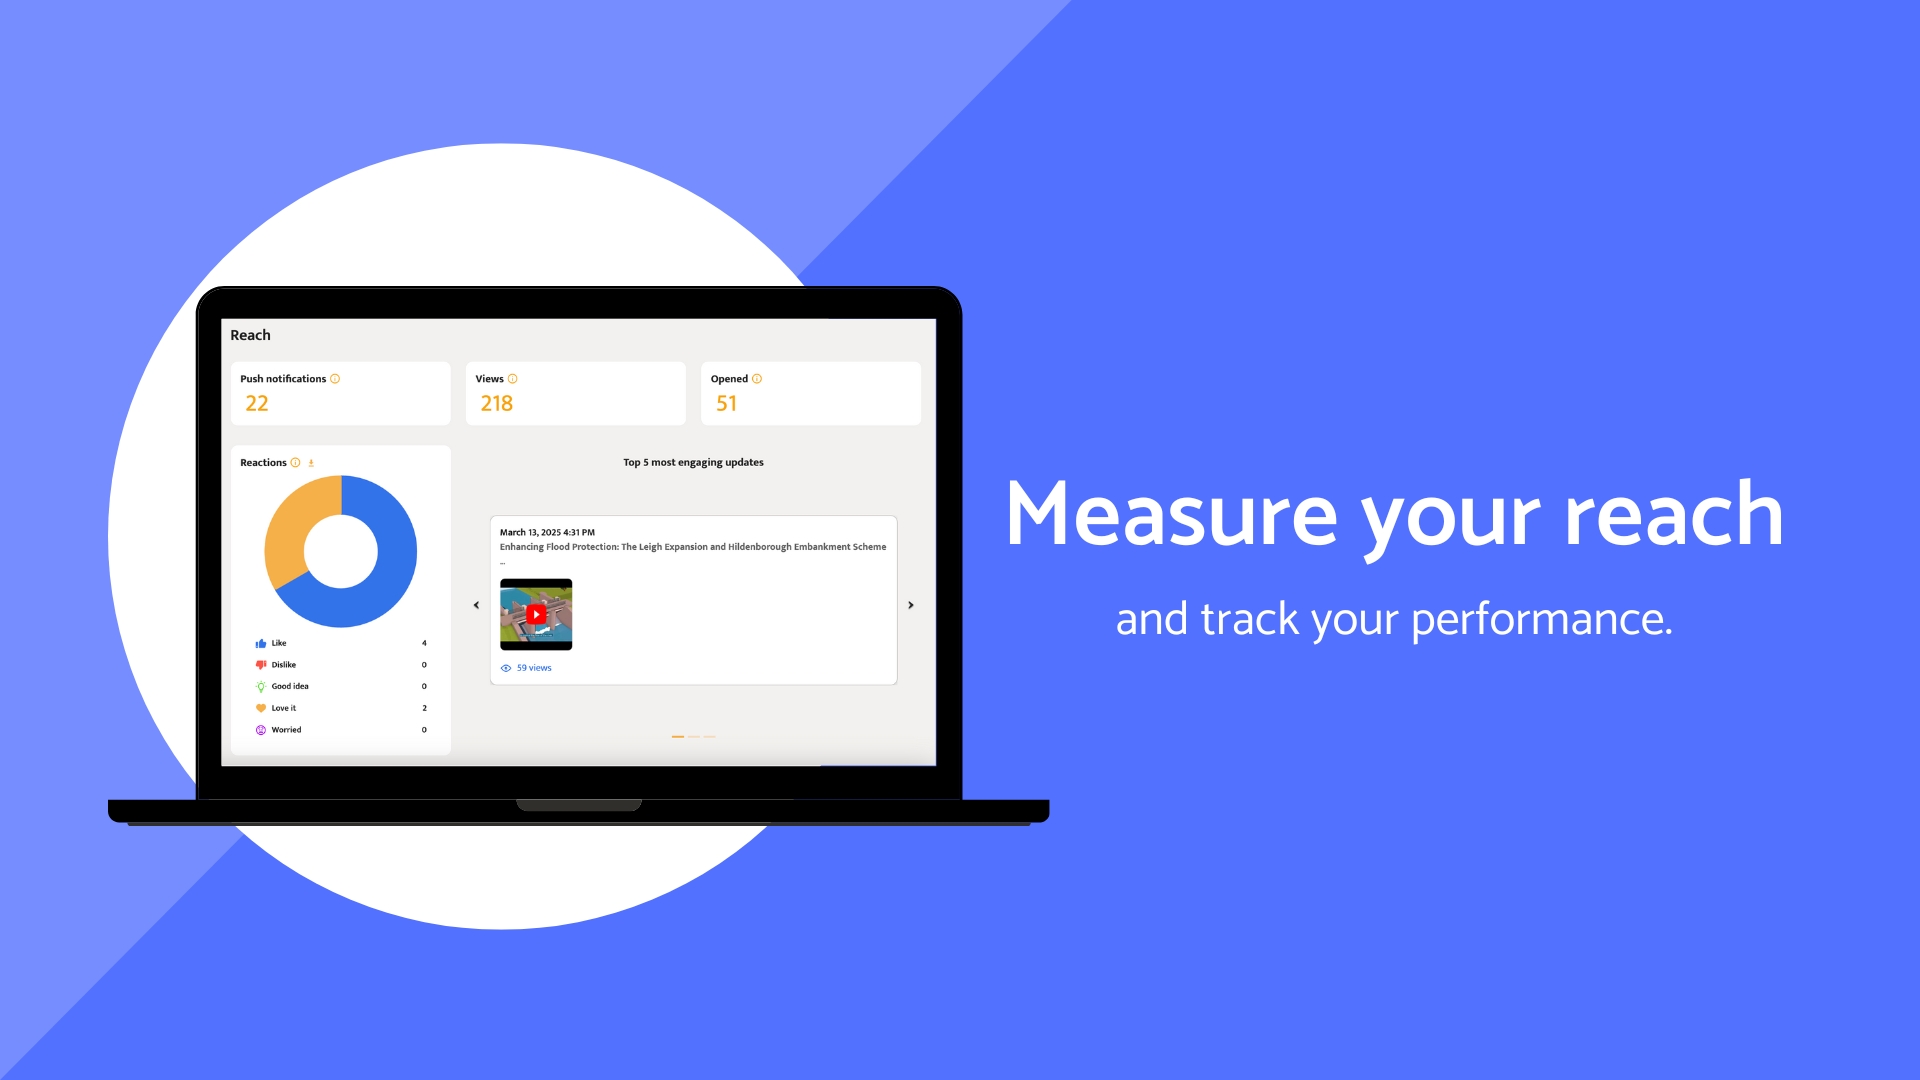
Your 5 most engaging updates
See which updates generated the most interest. This top 5 is based on:
- Views
- Opens
- Reactions
These insights help you spot the themes and tone that resonate best with your community.
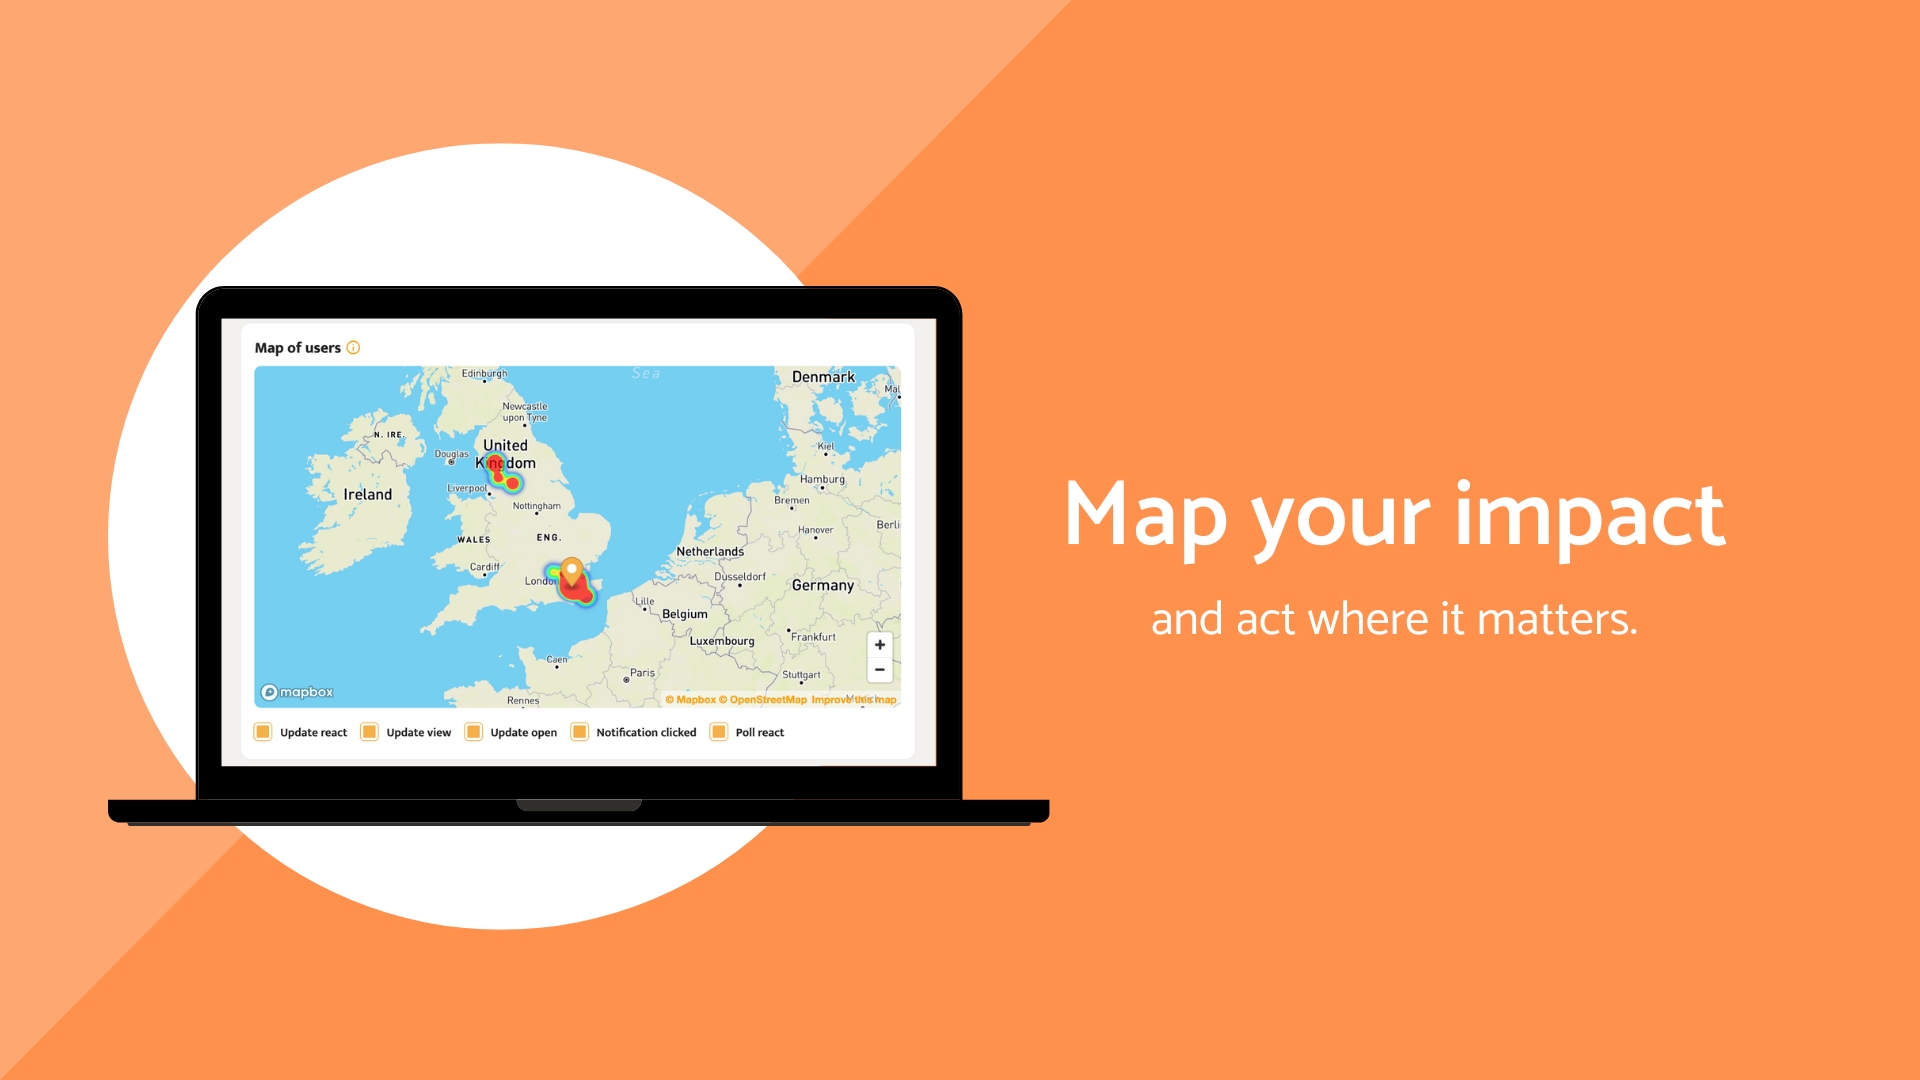
Where are users engaging from?
The new User Map shows the locations of users when they access your project. This is especially helpful for:
- Large project areas or long corridors
- Identifying low-engagement neighbourhoods
- Planning targeted promotion where needed
Track your Engagement Score
The Engagement Score shows how active your audience is, based on:
- Opens and clicks on updates
- Poll responses
- Reactions and conversations
It is updated weekly and benchmarked against the SitePodium average. Alongside your Feedback Rating, it gives a strong indication of how your project is being received.
Engaged users are not always happy ones. But a high engagement score with positive feedback? That is the sweet spot.

Go beyond views with detailed interaction insights
You can now see:
- How many polls were answered
- What types of conversations were started (Compliments, Questions, Complaints)
- Who engaged from which target groups
- How quickly responses were handled
This gives you a fuller picture of how your audience is participating.
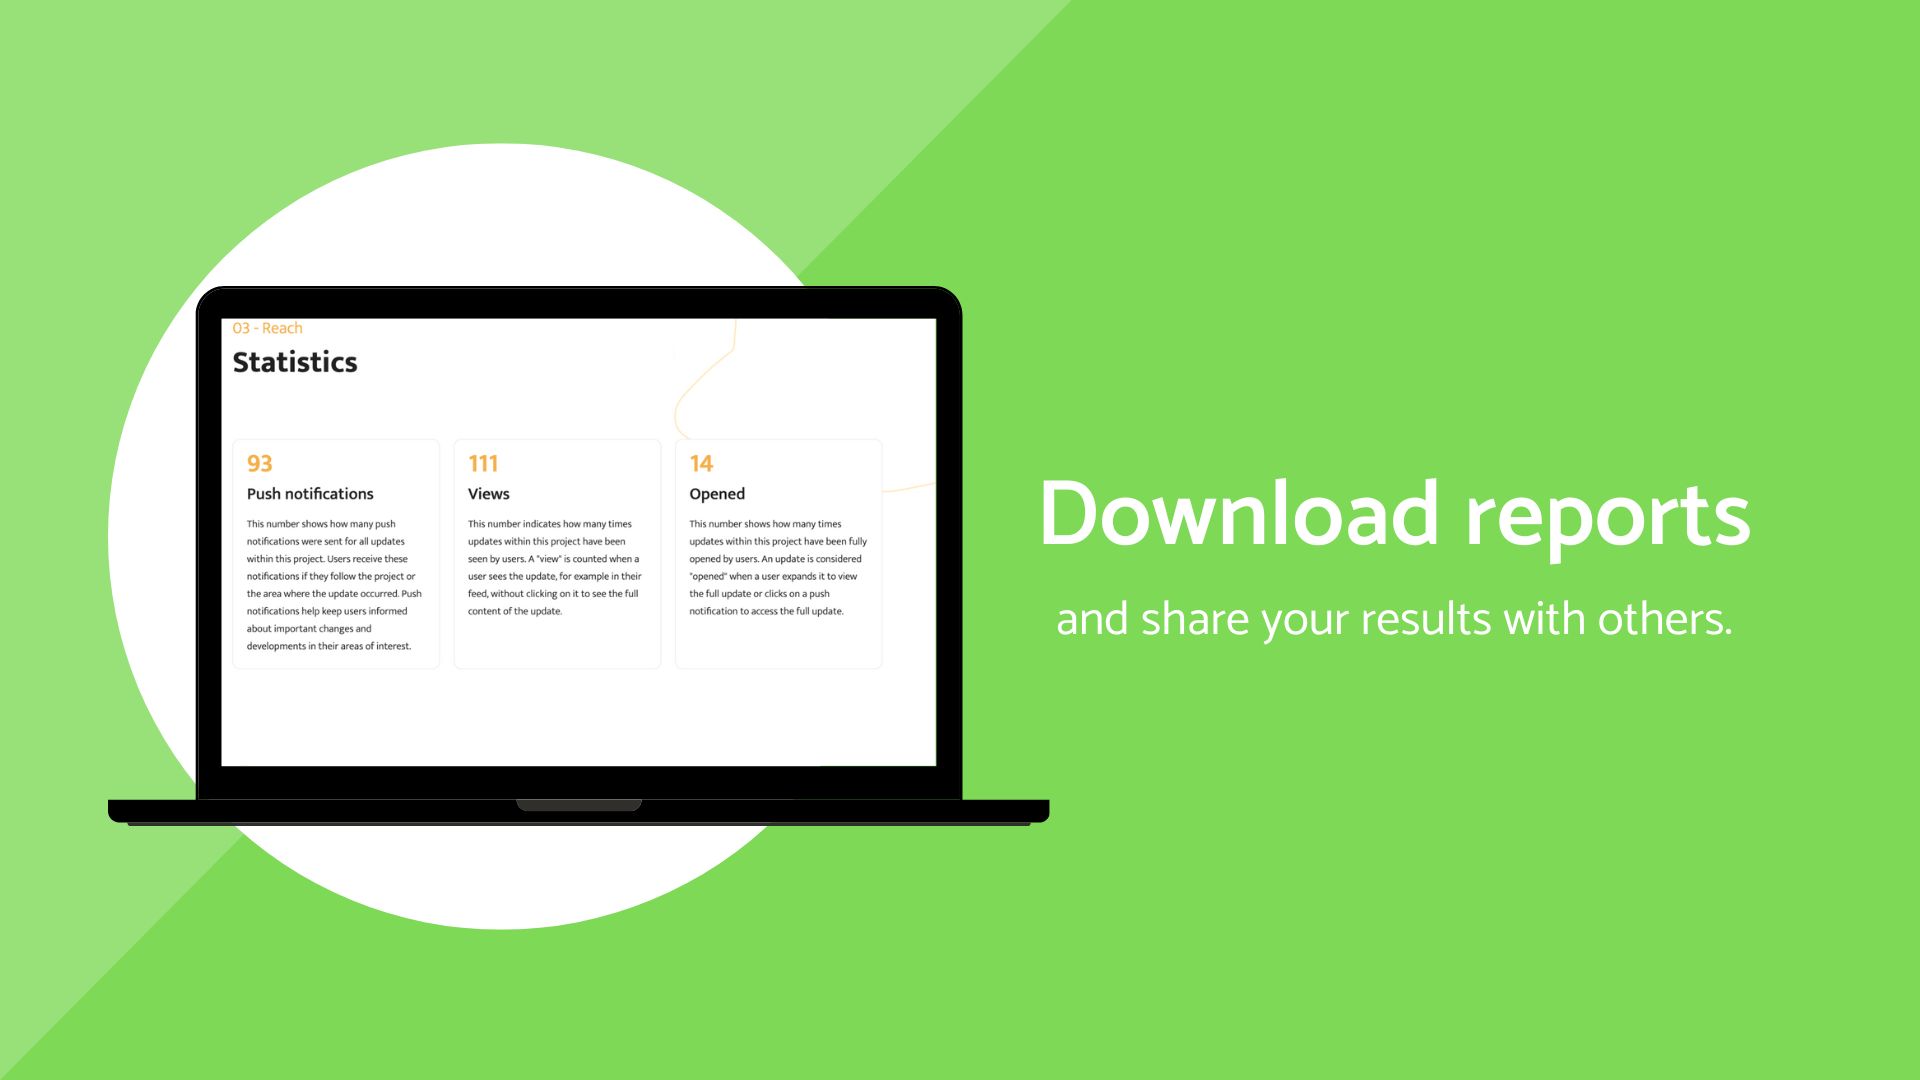
Need to share results? Download them
You can now download a full PDF report of your insights, ideal for:
- Sharing progress with colleagues or stakeholders
- Including in monthly reviews or client updates
- Archiving key project milestones
The report includes visuals, metrics and key interaction summaries. Simply select Download PDF in the top right corner of the Insights page.
Ready to try it?
The new Project Insights are currently available in beta. To open them:
- Locate the in-app message titled New Project Insights
- Select See it now
From there, explore your improved insights and discover how your project is performing. If you have feedback, we would love to hear it. Your input helps make SitePodium even better.